> ## Documentation Index
> Fetch the complete documentation index at: https://docs.launchblitz.ai/llms.txt
> Use this file to discover all available pages before exploring further.
# Create automation from scratch
> Build a Scrapist graph from the ground up.
This is the deep-dive guide to building Scrapist automations in the graph editor. Even if you start from a template, these concepts are what you use to customize it safely.
 ## 3.1 The graph editor
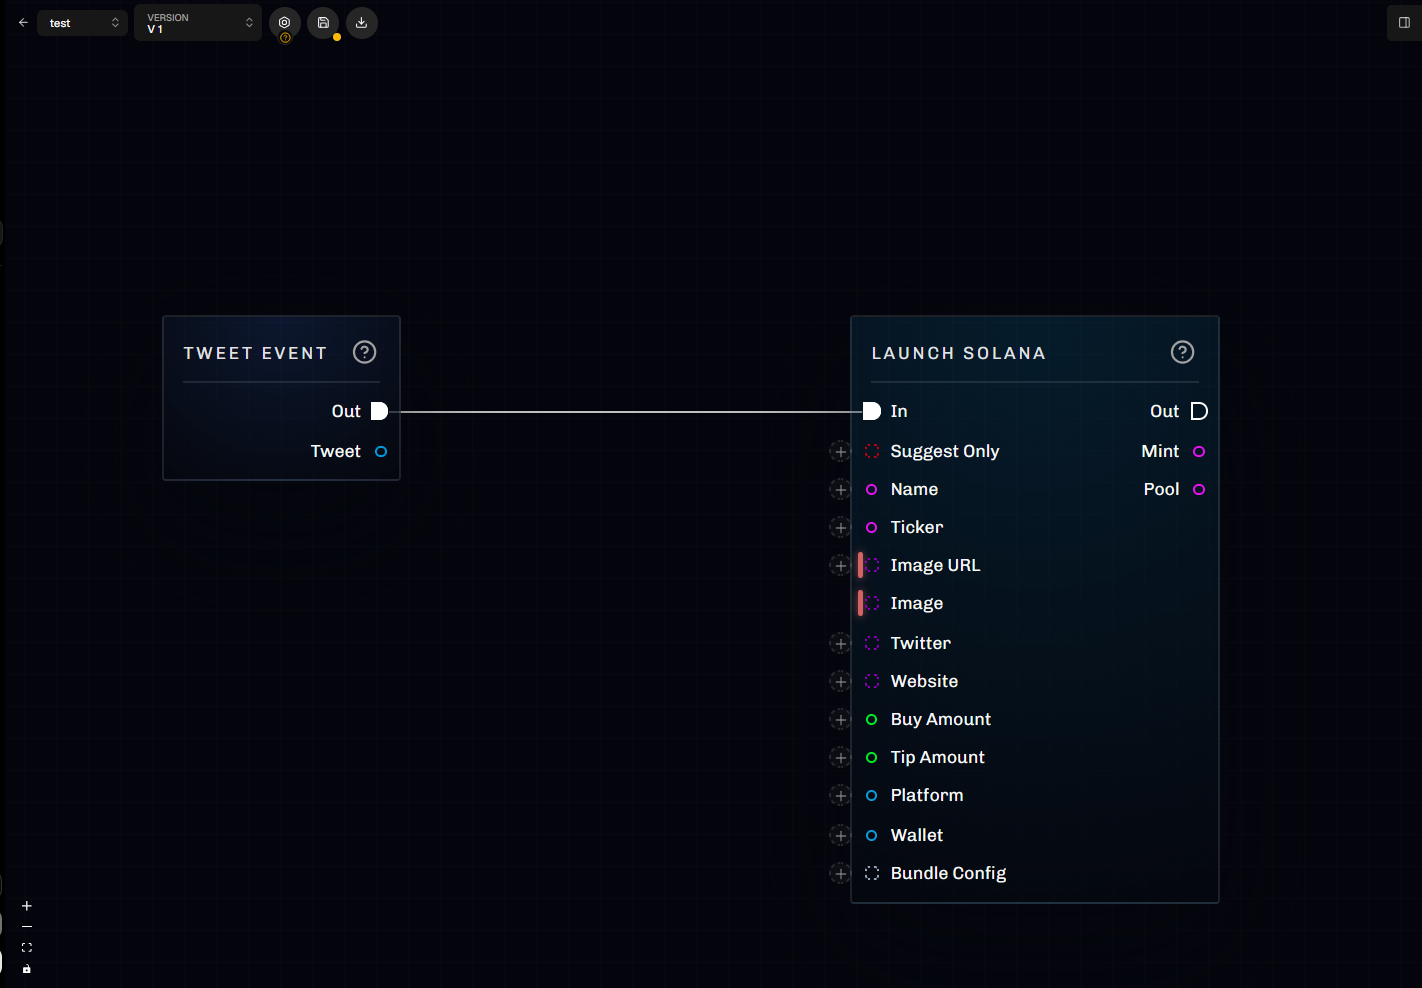
Scrapist uses a node-based canvas (visual scripting):
* **Right click** on the canvas to open the node palette and add nodes.
* **Backspace/Delete** removes selected nodes/edges (ReactFlow default).
* Drag from a port to connect wires.
* **Exec ports connect to exec ports**
* **Data ports connect to data ports**
* Data types and structures (scalar/array/map) must be compatible.
### Quick-add from a wire
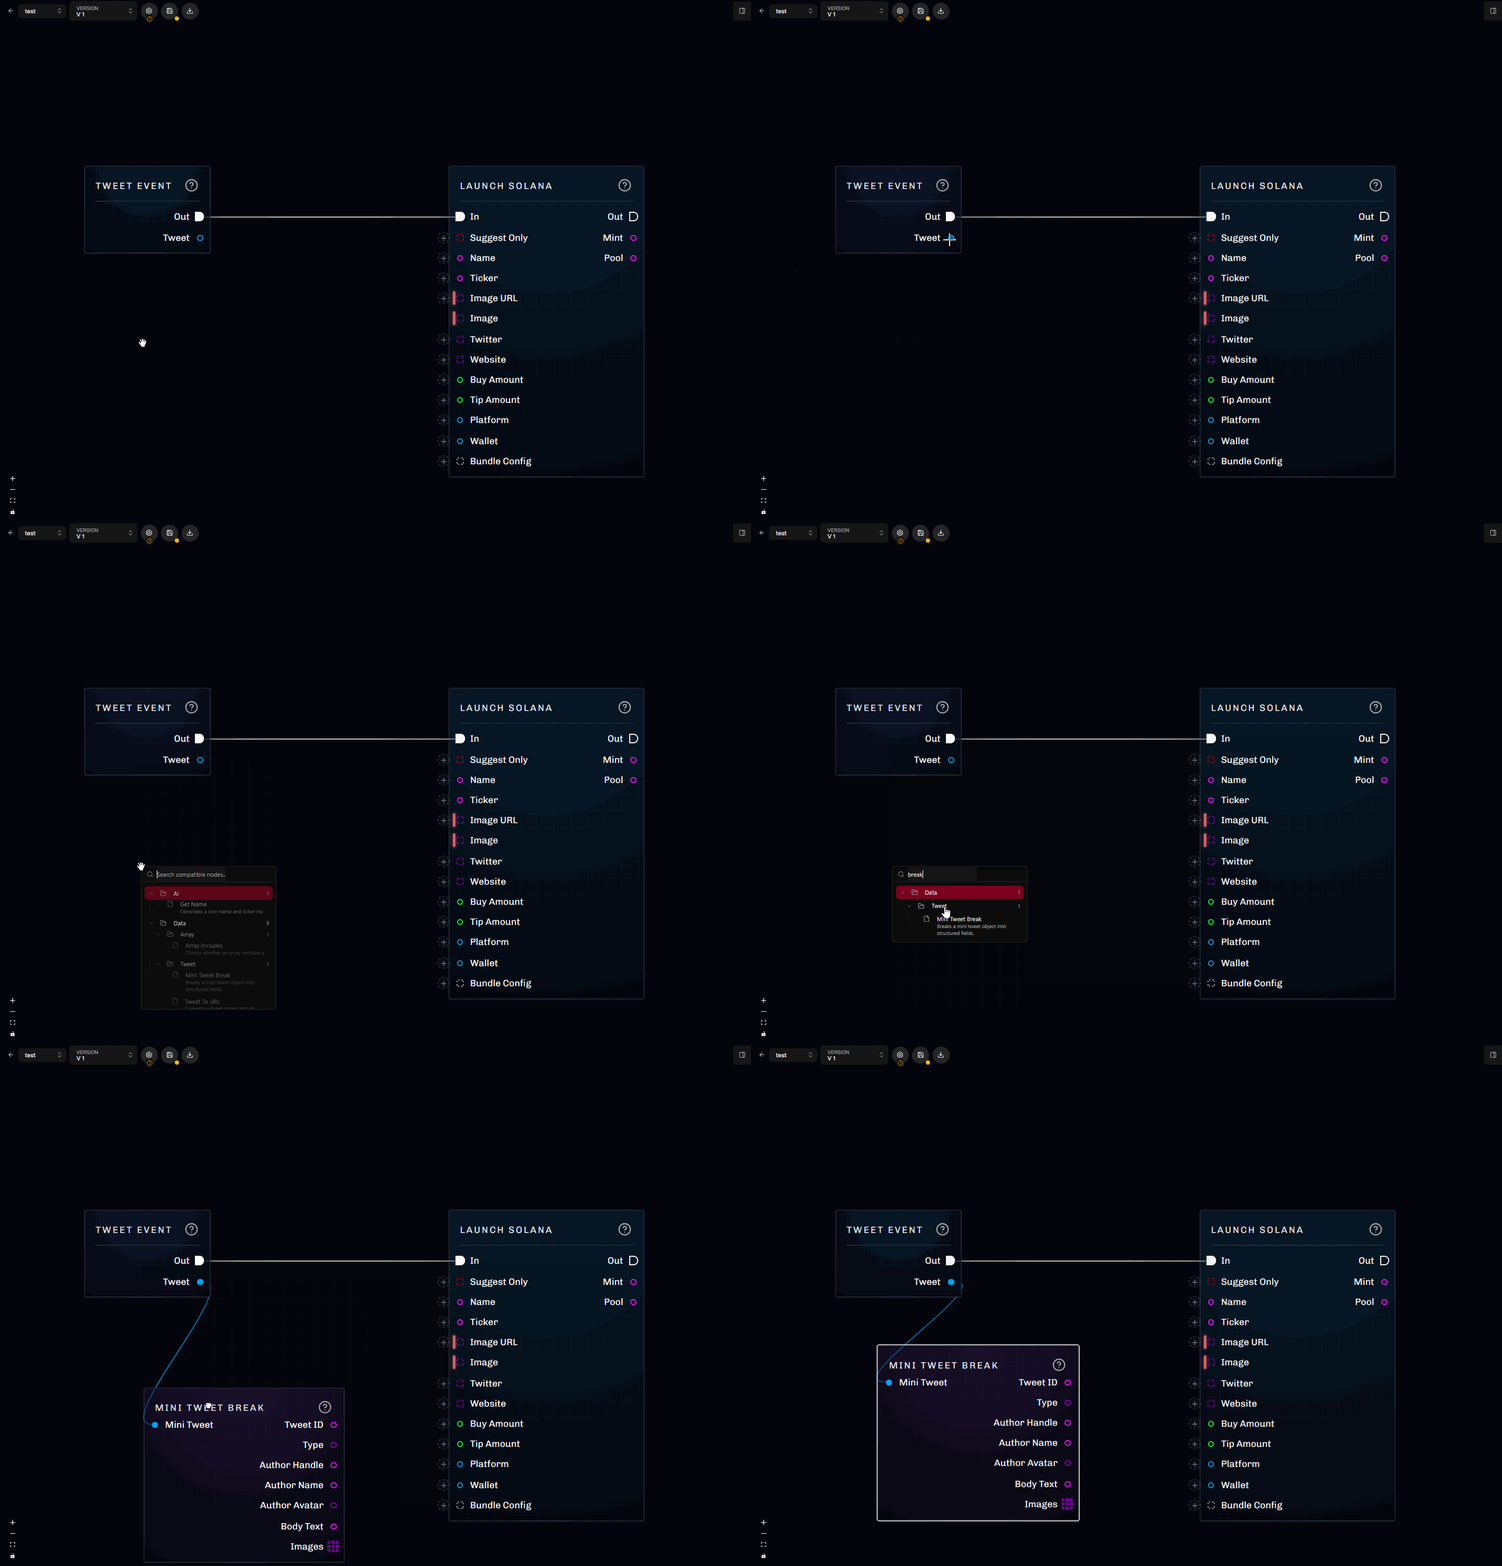
If you drag a connection into empty space, Scrapist opens a **filtered** node palette:
* It suggests nodes with compatible ports (matching kind/type/structure).
* It may pre-fill metadata (for example, setting a generic type on a new literal/cast/compare node).
* This is the fastest way to add new nodes when building out graphs
## 3.1 The graph editor
Scrapist uses a node-based canvas (visual scripting):
* **Right click** on the canvas to open the node palette and add nodes.
* **Backspace/Delete** removes selected nodes/edges (ReactFlow default).
* Drag from a port to connect wires.
* **Exec ports connect to exec ports**
* **Data ports connect to data ports**
* Data types and structures (scalar/array/map) must be compatible.
### Quick-add from a wire
If you drag a connection into empty space, Scrapist opens a **filtered** node palette:
* It suggests nodes with compatible ports (matching kind/type/structure).
* It may pre-fill metadata (for example, setting a generic type on a new literal/cast/compare node).
* This is the fastest way to add new nodes when building out graphs
 ### Inline literals
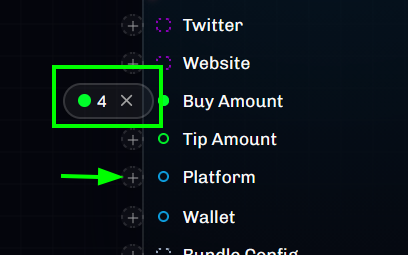
For many data inputs, you can attach a literal value directly at the port (instead of placing a separate literal node).
### Inline literals
For many data inputs, you can attach a literal value directly at the port (instead of placing a separate literal node).
 ### Editing templates vs starting blank
* **Templates** are great for production-ready starting points.
* **Blank graphs** are ideal for learning and for building specialized flows.
In both cases, the graph compiler enforces structure: one entrypoint, valid wiring, and no exec cycles.
## 3.2 Versions and saving
Scrapist graphs are versioned:
* **Save** writes nodes/edges/variables for the current version.
* **New version** creates a new numbered snapshot (V1, V2, …) so you can always roll back.
Recommended workflow:
1. Make edits.
2. Save.
3. Compile (to validate).
4. Deploy/activate an instance.
If you’re experimenting, create a new version before large refactors. It’s the easiest way to “have something to go back to.”
## 3.3 Variables
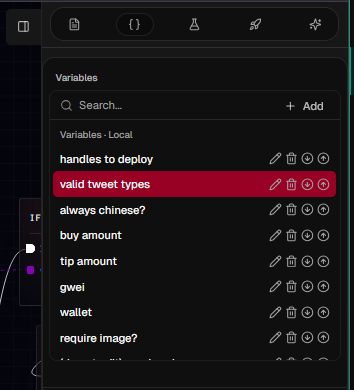
Graph variables are named values that live alongside your graph:
* They provide **configuration** (amounts, thresholds, wallet/platform selection, etc.)
* They can also act as **state** if you mutate them during a run
Each variable has:
* **Type** (`string`, `number`, `tweet_type`, `solana_wallet`, etc.)
* **Structure** (`scalar`, `array`, `map`)
* **Default value** (stored as JSON)
* **Instance exposed** (whether it’s intended to be configured per instance/dashboard and overridden in tests)
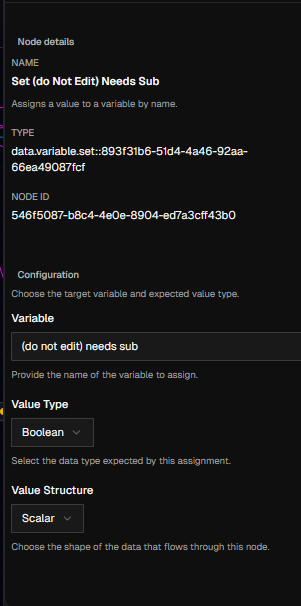
### Get/Set nodes
* `data.variable.get` reads the current value.
* `data.variable.set::` (shown as “Set Variable”) updates the value during execution.
* Set requires an exec arrival (`exec-in`) to avoid accidental writes from “pure” data flows.
When a variable is set, the runtime increments its internal epoch. Cached exec-free computations that depend on that variable are invalidated automatically.
### Editing templates vs starting blank
* **Templates** are great for production-ready starting points.
* **Blank graphs** are ideal for learning and for building specialized flows.
In both cases, the graph compiler enforces structure: one entrypoint, valid wiring, and no exec cycles.
## 3.2 Versions and saving
Scrapist graphs are versioned:
* **Save** writes nodes/edges/variables for the current version.
* **New version** creates a new numbered snapshot (V1, V2, …) so you can always roll back.
Recommended workflow:
1. Make edits.
2. Save.
3. Compile (to validate).
4. Deploy/activate an instance.
If you’re experimenting, create a new version before large refactors. It’s the easiest way to “have something to go back to.”
## 3.3 Variables
Graph variables are named values that live alongside your graph:
* They provide **configuration** (amounts, thresholds, wallet/platform selection, etc.)
* They can also act as **state** if you mutate them during a run
Each variable has:
* **Type** (`string`, `number`, `tweet_type`, `solana_wallet`, etc.)
* **Structure** (`scalar`, `array`, `map`)
* **Default value** (stored as JSON)
* **Instance exposed** (whether it’s intended to be configured per instance/dashboard and overridden in tests)
### Get/Set nodes
* `data.variable.get` reads the current value.
* `data.variable.set::` (shown as “Set Variable”) updates the value during execution.
* Set requires an exec arrival (`exec-in`) to avoid accidental writes from “pure” data flows.
When a variable is set, the runtime increments its internal epoch. Cached exec-free computations that depend on that variable are invalidated automatically.
 ## 3.4 Node metadata
Many nodes have configurable metadata in the sidebar. Metadata can:
* Change how the node behaves (e.g., string replace settings)
* Change port types/structures (generic nodes like literal/cast/compare)
* Add dynamic ports (switch cases, AI prompt output fields)
Common examples:
* **Literal value** (`data.literal`): choose value type + structure, then set the value.
* **Compare** (`logic.compare`): set operator (`==`, `!=`, `>`, etc.) and choose the comparison type.
* **Switch** (`logic.switch`): configure cases; each case becomes an exec output port.
* **AI Prompt** (`ai.prompt`): configure `outputFields` to add data outputs like `field.name`, `field.ticker`, etc.
* **Delay** (`action.delay`): can use a default delay from metadata if no input is wired.
## 3.4 Node metadata
Many nodes have configurable metadata in the sidebar. Metadata can:
* Change how the node behaves (e.g., string replace settings)
* Change port types/structures (generic nodes like literal/cast/compare)
* Add dynamic ports (switch cases, AI prompt output fields)
Common examples:
* **Literal value** (`data.literal`): choose value type + structure, then set the value.
* **Compare** (`logic.compare`): set operator (`==`, `!=`, `>`, etc.) and choose the comparison type.
* **Switch** (`logic.switch`): configure cases; each case becomes an exec output port.
* **AI Prompt** (`ai.prompt`): configure `outputFields` to add data outputs like `field.name`, `field.ticker`, etc.
* **Delay** (`action.delay`): can use a default delay from metadata if no input is wired.
 ## 3.5 Testing
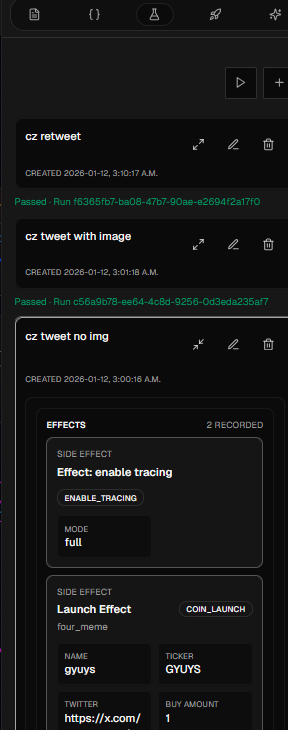
The **Tests** tab runs your graph against synthetic tweet data (no live tweeting required).
Tests let you control:
* The tweet payload (text, images, author, subtweet)
* Variable overrides (typically for **instance-exposed** variables)
When you run a test, Scrapist calls the backend graph API (`/graph/run`) with tracing enabled and shows the trace output in the UI.
If a test fails:
* You’ll usually get an error with a node ID (and sometimes an edge ID).
* The UI can highlight the failing node/edge on the canvas.
## 3.5 Testing
The **Tests** tab runs your graph against synthetic tweet data (no live tweeting required).
Tests let you control:
* The tweet payload (text, images, author, subtweet)
* Variable overrides (typically for **instance-exposed** variables)
When you run a test, Scrapist calls the backend graph API (`/graph/run`) with tracing enabled and shows the trace output in the UI.
If a test fails:
* You’ll usually get an error with a node ID (and sometimes an edge ID).
* The UI can highlight the failing node/edge on the canvas.
 ## 3.6 Trace viewer
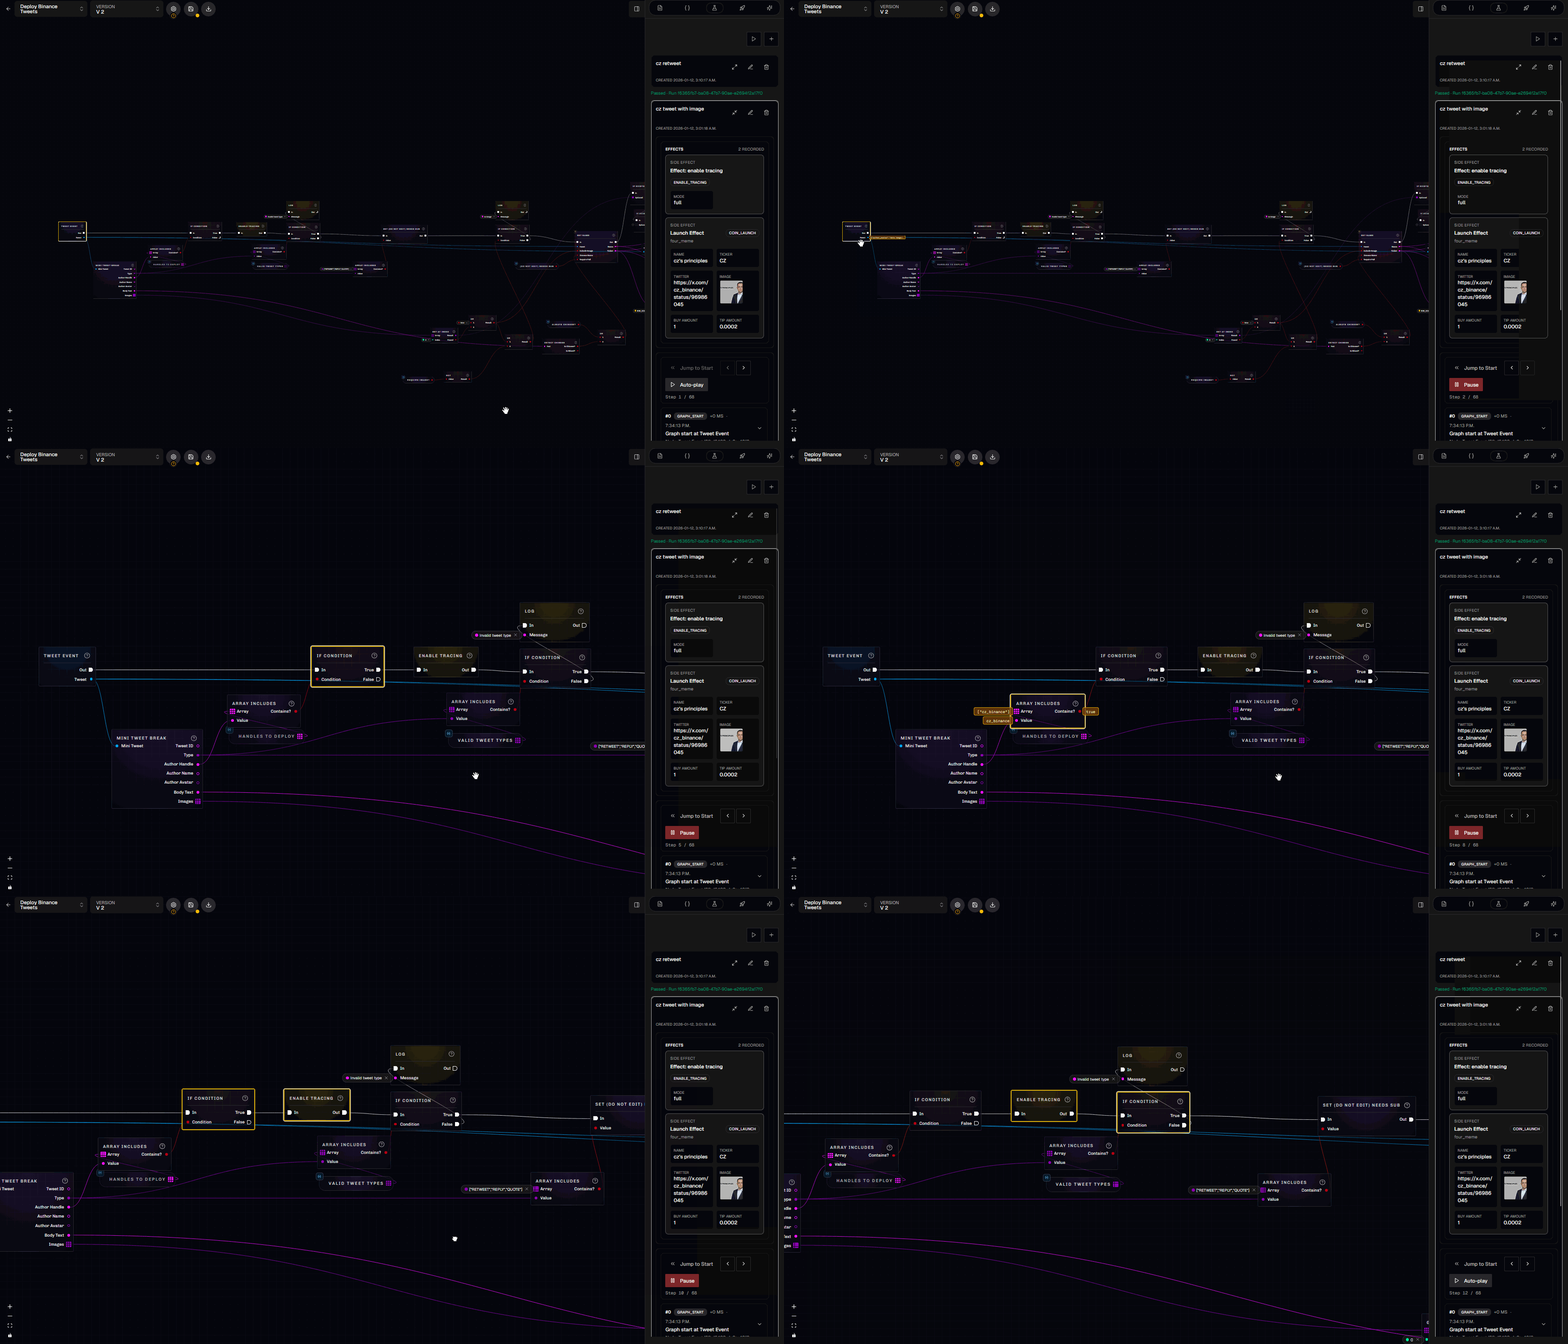
Traces are how you debug “what actually happened” during a run.
In the trace viewer you can step through:
* Which nodes ran (in exec order)
* What inputs each node received
* What outputs it produced
* Which exec branch was taken
* Variable mutations and cache hits
* Effects emitted (e.g., `coin_launch`, `notify`)
Two key runtime details:
* **Exec-free nodes** may appear in the trace as being executed “for” another node (they were evaluated to satisfy an input).
* Trace payloads are sanitized (sensitive keys redacted, long values truncated).
For deployed instances, traces may only be persisted when your graph hits `debug.enableTracing` (depending on your backend’s trace persistence configuration).
## 3.6 Trace viewer
Traces are how you debug “what actually happened” during a run.
In the trace viewer you can step through:
* Which nodes ran (in exec order)
* What inputs each node received
* What outputs it produced
* Which exec branch was taken
* Variable mutations and cache hits
* Effects emitted (e.g., `coin_launch`, `notify`)
Two key runtime details:
* **Exec-free nodes** may appear in the trace as being executed “for” another node (they were evaluated to satisfy an input).
* Trace payloads are sanitized (sensitive keys redacted, long values truncated).
For deployed instances, traces may only be persisted when your graph hits `debug.enableTracing` (depending on your backend’s trace persistence configuration).
 ## 3.7 Instances
Instances (deployments) are how a graph version becomes live.
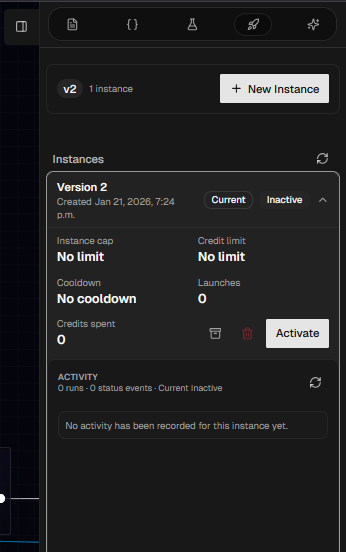
In the **Instances** tab you can:
1. Create a new instance for the current version.
2. Configure limits (cap/cooldown/credits).
3. Activate when ready.
4. Review past runs and status-change history.
Important: The editor requires a successful **compile** with no edits since compile before deploying. If you change the graph, compile again.
## 3.7 Instances
Instances (deployments) are how a graph version becomes live.
In the **Instances** tab you can:
1. Create a new instance for the current version.
2. Configure limits (cap/cooldown/credits).
3. Activate when ready.
4. Review past runs and status-change history.
Important: The editor requires a successful **compile** with no edits since compile before deploying. If you change the graph, compile again.